Updated April 2023 to allow for the most recent Bureau of Labor Statistics salary data collected in May 2022.
How much does a Surgical Tech make?
If you are thinking of becoming a Surgical Technologist then you will not doubt be interested in learning how much Surgical Techs make?
The good news is that both employment levels and pay for Surgical Techs has been increasing steadily since 2000. In fact Surgical Techs now earn 55% more than they did 15 years ago and employment has increased by 48%.
And the good news is this trend is set to continue with the Bureau for Labor Studies predicting that demand for Surgical Technologists will grow by a further 12,000 between 2016 and 2024.
Contents
- National average salary data
- How much does a Surgical Tech make an hour?
- Top paying States
- Salary by State
- Top paying Metro and non Metro areas
- Salary comparison with related careers
- Jobs and employment
Average Surgical Tech Salary
| May, 2017 | |
|---|---|
| Average salary | $48,060 |
| Hourly wage | $23.11 |
| 90th Percentile of Earners | $67,000 |
| 10th Percentile of Earners | $32,470 |
| Top Paying State: California | $61,240 |
| Bottom Paying State: Alabama | $36,320 |
| # Employed | 106,470 |
The average salary for Surgical Technologists as of March 2018 was $48,060.
Salary can range quite significantly depending on where you live and how much experience you have. There is a significant range in average earnings from a low of $36,320 in Alabama to a high of $61,240 in California. This represents a possible range of over $25,000 per annum based on where you live.
Surgical Tech’s working in San Rafael, California earned the most of all in the USA with an average Salary of €77,350, a huge 68.4% above the national average.
Overall the best paid in the field (top 10%) earn an average income of $67,000. Those in the bottom 10% of earners, or in entry level positions, earn just $32,470 per annum.
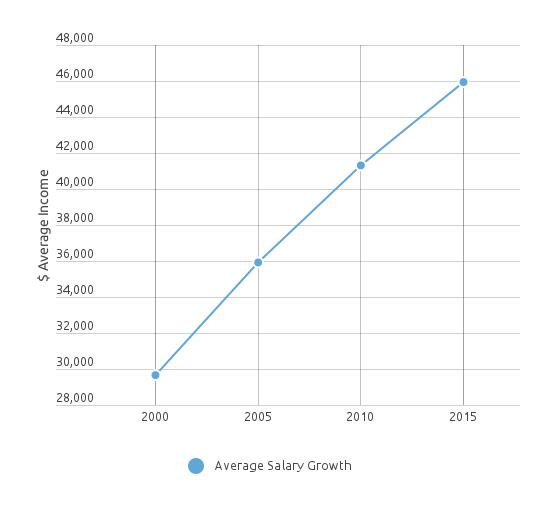
As illustrated in the graph below salary levels for Surgical Techs have continued to grow significantly with an increase of over 11% in the 5 year period since 2010 and by almost 55% since 2000.
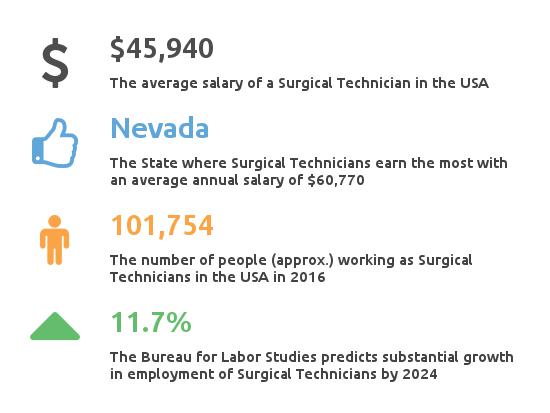
The image below illustrates key salary and employment data for Surgical Techs in the USA;
How much does a Surgical Techs make an hour?
The mean hourly wage for Surgical Techs in the USA is $22.09
Top paying States for Surgical Techs
The table below illustrates the States in which Surgical Technologists can earn the most – taking into consideration cost of living adjustments for each State.
| State | Salary | Above Average | Hourly Wage | #'s Employed |
|---|---|---|---|---|
| California | $61,240 | 27% | $29.44 | 9,800 |
| Alaska | $60,180 | 25% | $28.93 | 140 |
| Nevada | $59,750 | 24% | $28.73 | 910 |
| Washingon DC | $58,120 | 21% | $27.94 | 270 |
| Hawaii | $56,620 | 18% | $27.22 | 260 |
Surgical Tech Salaries by State
Browse the map below to find out how much does a Surgical Technologist make in your State;
Alabama / Alaska / Arizona / Arkansas / California / Colorado / Connecticut / Delaware / Florida / Georgia / Hawaii / Idaho / Illinois / Indiana / Iowa / Kansas / Kentucky / Louisiana / Maine / Maryland / Massachusetts / Michigan / Minnesota / Mississippi / Missouri / Montana / Nebraska / Nevada / New Hampshire / New Jersey / New Mexico / New York / North Carolina / North Dakota / Ohio / Oklahoma / Oregon / Pennsylvania / Rhode Island / South Carolina / South Dakota / Tennessee / Texas / Utah / Vermont / Virginia / Washington / Washington DC / West Virginia / Wisconsin / Wyoming
Top paying Metro Areas for Surgical Techs
The table below illustrates the Cities and Metro Areas in which Surgical Technologists can earn the most – taking into consideration cost of living adjustments.
| City / Metro Area | Salary | Above Average |
|---|---|---|
| San Rafael, CA Metropolitan Division | $77,350 | 68.4% |
| San Francisco-Redwood City-South San Francisco, CA Metropolitan Division | $74,510 | 62.2% |
| San Francisco-Oakland-Hayward, CA | $71,400 | 55.4% |
| Vallejo-Fairfield, CA | $69,740 | 51.8% |
| Oakland-Hayward-Berkeley, CA Metropolitan Division | $69,180 | 50.6% |
How much do Surgical Techs make compared with related Healthcare careers?
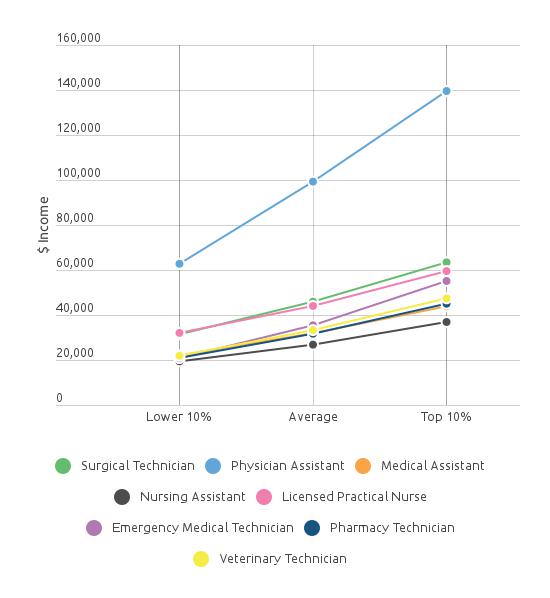
The data presented illustrates the range from the lower 10% of salaries, to the median or average salary, to the top 10% of salaries for each career.
With the exception of Physician Assistants, Surgical Technologists enjoy slightly higher averages across the range than all other related careers.
Surgical Tech Jobs & Employment
Unsurprisingly the vast majority of Surgical Techs are employed in Hospitals, accounting for approximately 70% of employment in the industry.
| Industry | # Employed |
|---|---|
| General Medical and Surgical Hospitals | 69,350 |
| Offices of Physicians | 12,450 |
| Outpatient Care Centers | 9,500 |
| Offices of Dentists | 4,450 |
| Other | 1,440 |
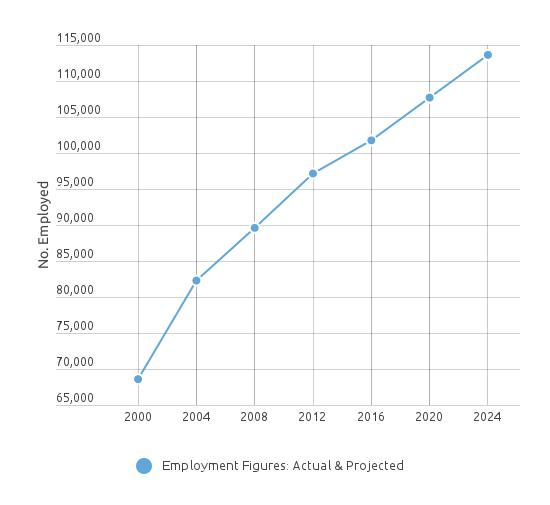
As you can see from the graph below the outlook for jobs growth and opportunity for those who qualify as Surgical Technologists is incredibly favorable. The data, taken from the Bureau of Labor Statistics, predicts that between 2016 and 2024 there will be over 12,000 new positions created in the sector representing an increase of over 11% in employment.


